
Government agencies, non-profit groups, and even non bank enterprises produce economic studies and macroeconomic indicators, which are frequently substantial numbers. They provide data for assessing the state of our economy, recent business cycles, and how consumers are spending and faring in general.
On a daily, weekly, monthly, and/or quarterly basis, various major economic indicators are released. While keeping an eye on the economy is crucial, few analysts or economists have the time to go through huge amounts of data.
Which reports are worth your time and money, and why?
Here’s a quick rundown of the most important economic leading indicators. Even if you don’t follow these reports closely, it’s useful to understand where the “experts” get their information. If you do decide to read these publications, keep in mind that statistics might be misleading.
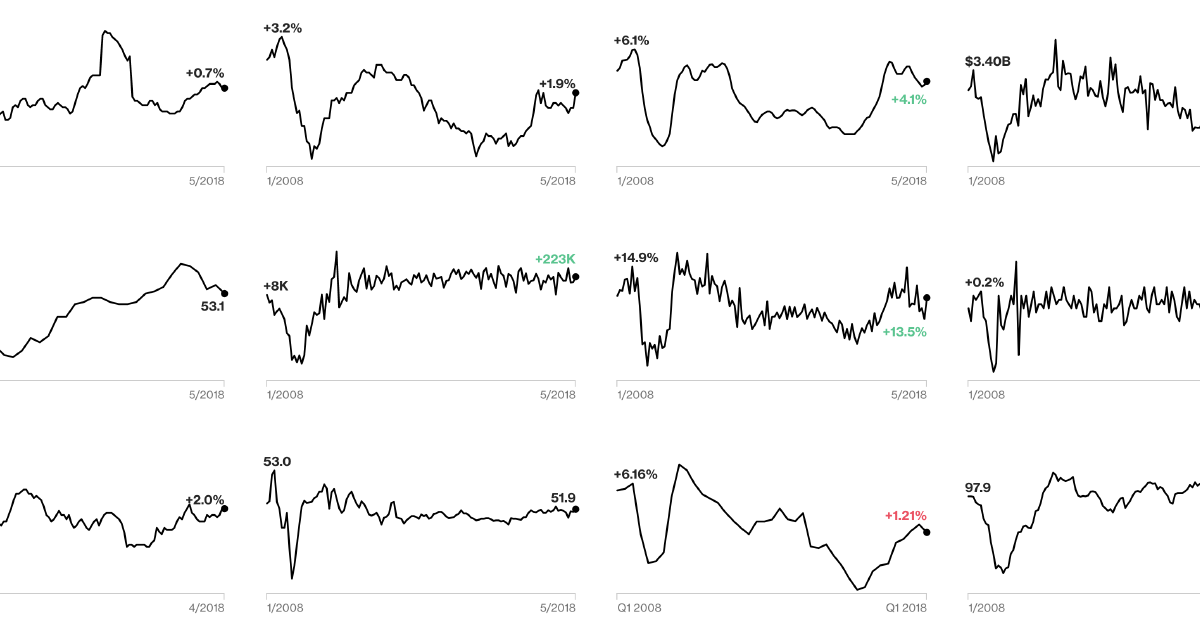
54.1
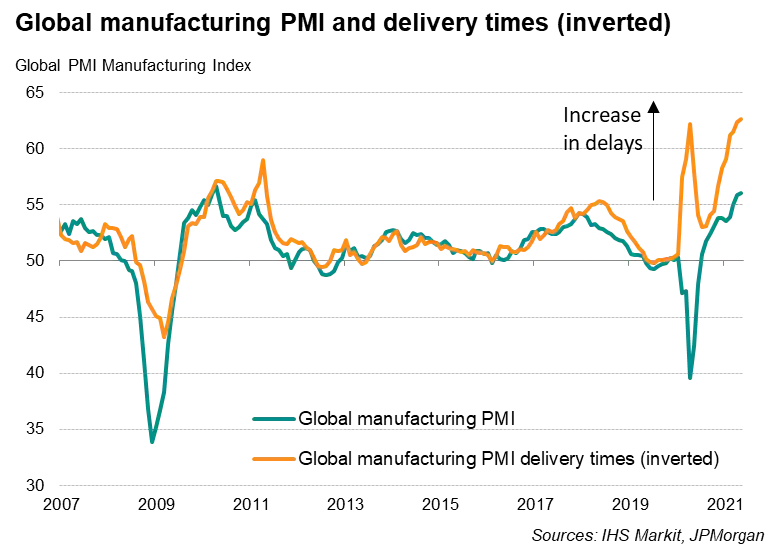
Global PMI
A view of the health of manufacturing around the world from IHS Markit and JPMorgan Chase, based on surveys of different purchasing managers’ activity. A value greater than 50 denotes growth. Updates on a monthly basis: 1st of October, 2021
+194K
Employment in the United States
A measure of how tight the labor market in the world’s largest economy is running. Updates on a monthly basis 8th of October, 2021

+0.8%
Consumer Spending in the United States
The consumer in the United States is normally one of the cornerstones of the global economy, and this data demonstrates how they are faring. Last updated on October 1, 2021.

+12.42%
Brazil’s Gross Domestic Product
Commodity exporters all over the world use this as a proxy. Quarterly updates 1st of September, 2021.

$4.16B
Copper Exports from Chile
Copper production in Chile. Copper is used in everything from automobiles to television sets to high-tech wiring, and the Andean nation is the world’s greatest producer. If demand is strong, the global economy will most likely be strong as well. Last updated on October 7, 2021.

+3.4%
Euro-Area Inflation
The principal indicator tracked by the European Central Bank is a measurement of inflation in the euro region. Updates on a monthly basis The 20th of October, 2021 was the last day of the year.

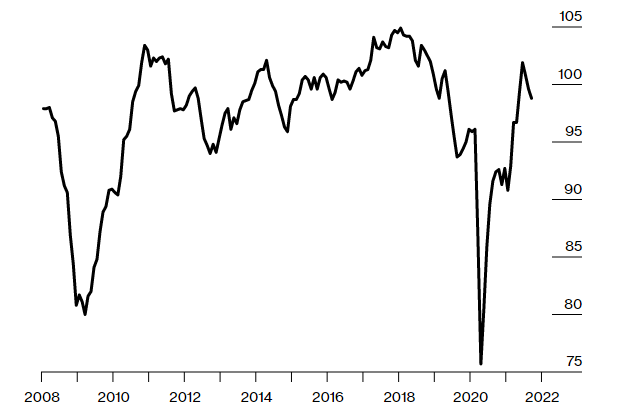
98.8
German Ifo
It is based on a survey of nearly 7,000 executives in German manufacturing, services, retail, wholesale, and construction sectors, and is the key indicator of health in the euro area’s lynchpin economy. The goal is to get a sense of how they think the economy is doing and what they think the future holds.
Last updated on September 24, 2021.
Furthermore,
The Federal Reserve uses a broad number of indicators of current and future output, employment, inflation, and economic circumstances to monitor the economy and set monetary policy. Most policymakers, on the other hand, do not believe that any single indication is “reliable enough to be utilized mechanically as a solitary aim or policy guide.”
Movements in a number of key indicators assist the Federal Reserve track its progress toward its two main economic objectives: promoting “maximum” output and employment and “stable” prices. In this process, several of the signs stated in your question play a significant role.
Gross domestic product, or GDP, is the most complete measure of overall economic performance, as it represents the “output” or total market value of goods and services produced in the domestic economy during a certain time period.
Because it encompasses the production of all sectors of the economy, GDP is perhaps the best indicator of the overall state of the economy. Although the National Bureau of Economic Research uses more timely monthly indicators to determine official business cycle dates, it is common to use the quarterly real GDP series (nominal GDP adjusted to remove the effects of inflation) to determine the timing of business cycle expansions and recessions.
Overall labor market conditions are measured by total nonfarm payroll employment. Job growth is considered a coincident economic indicator, which means that it moves in lockstep with GDP and the entire economy. Analysts can assess the health of labor markets by combining data from job growth with data from unemployment rates and other labor market indicators.
Inflation can be quantified in a variety of ways. It is defined as “the rate of growth in the general price level of goods and services.” The consumer price index (CPI) is a popular inflation indicator.
The producer price index, which monitors the prices producers pay for inputs, and the GDP deflator, which adjusts GDP for changes in the general price level over time, are two other commonly observed inflation metrics. To measure both the level of inflation and inflation expectations in the economy, analysts look at movements in both variables, as well as interest rate spreads, the yield curve, and gauges and surveys of inflation predictions.
Conclusions
The requirements for the Structural Fund are specified by clear and straightforward metrics that indicate low GDP areas for Objective 1 and high and structural unemployment areas for Objective 2. Regardless of any apparent flaws in these indicators, they are likely to be at the center of decision-making in the medium term.
However, the indicators’ simplicity, while a strength, also has a drawback in that it does not always target the areas with the highest need.
They don’t take into account the vastly varying social and economic conditions that exist within areas. The dissimilar situations and disadvantages faced in inner city locations and island regions are two specific instances.
As the notion of increasing subsidiarity collides with the purpose of concentrating financial aid to accomplish EC goals, tensions are forming. While these may be able to withstand the current Structural Funds assessment, more fundamental adjustments will be required in following rounds.